April Gallegos
  • About Me
  • Contact

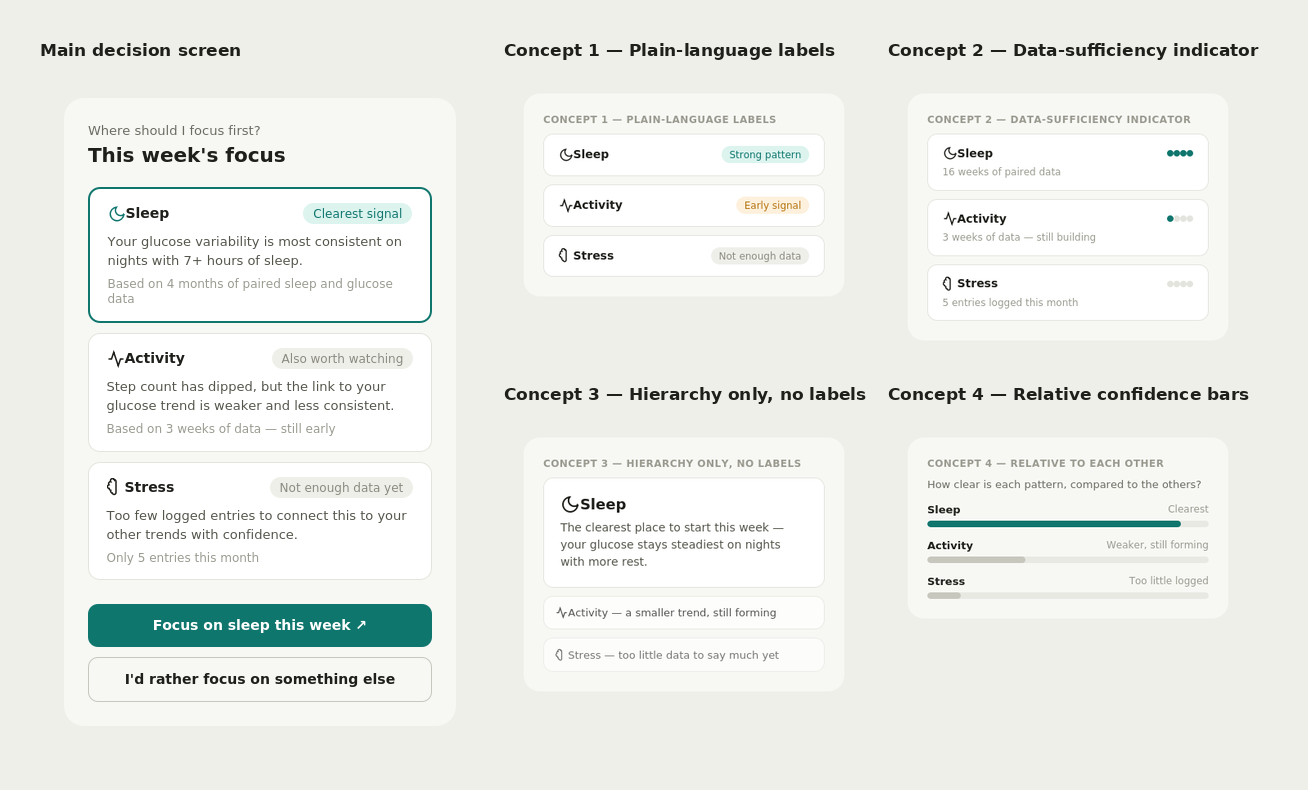
Using Claude to generate variations of different views for the signals
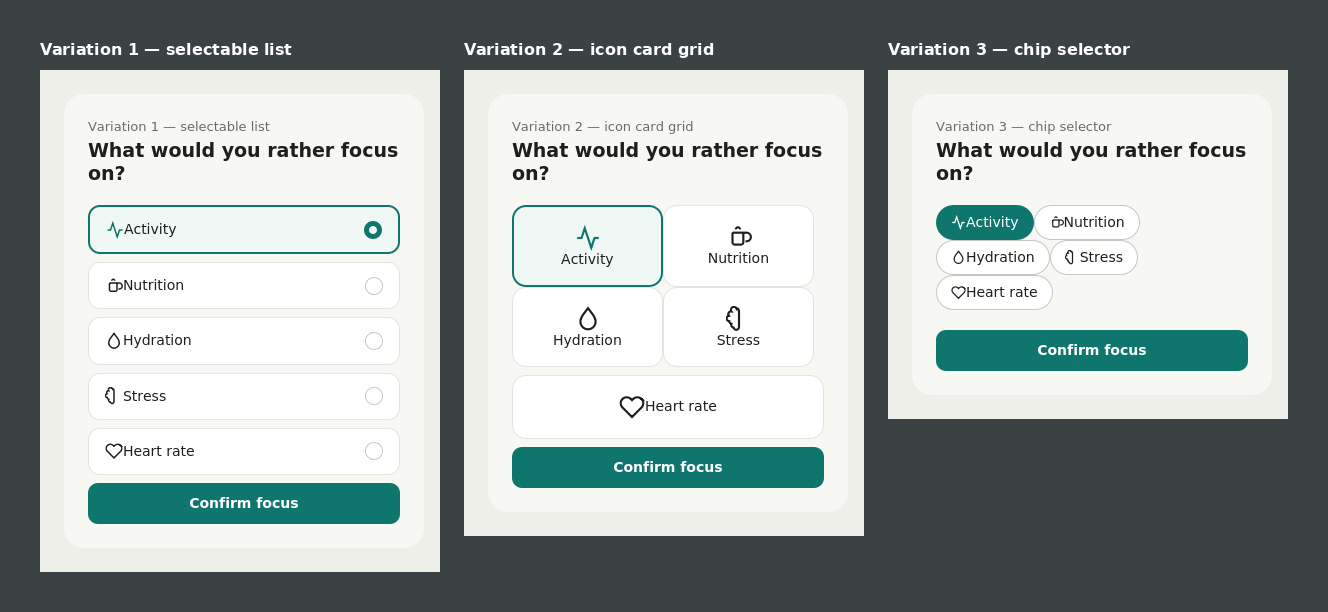
Using Claude for variations of how users select a different focus (human-in-the-loop override)
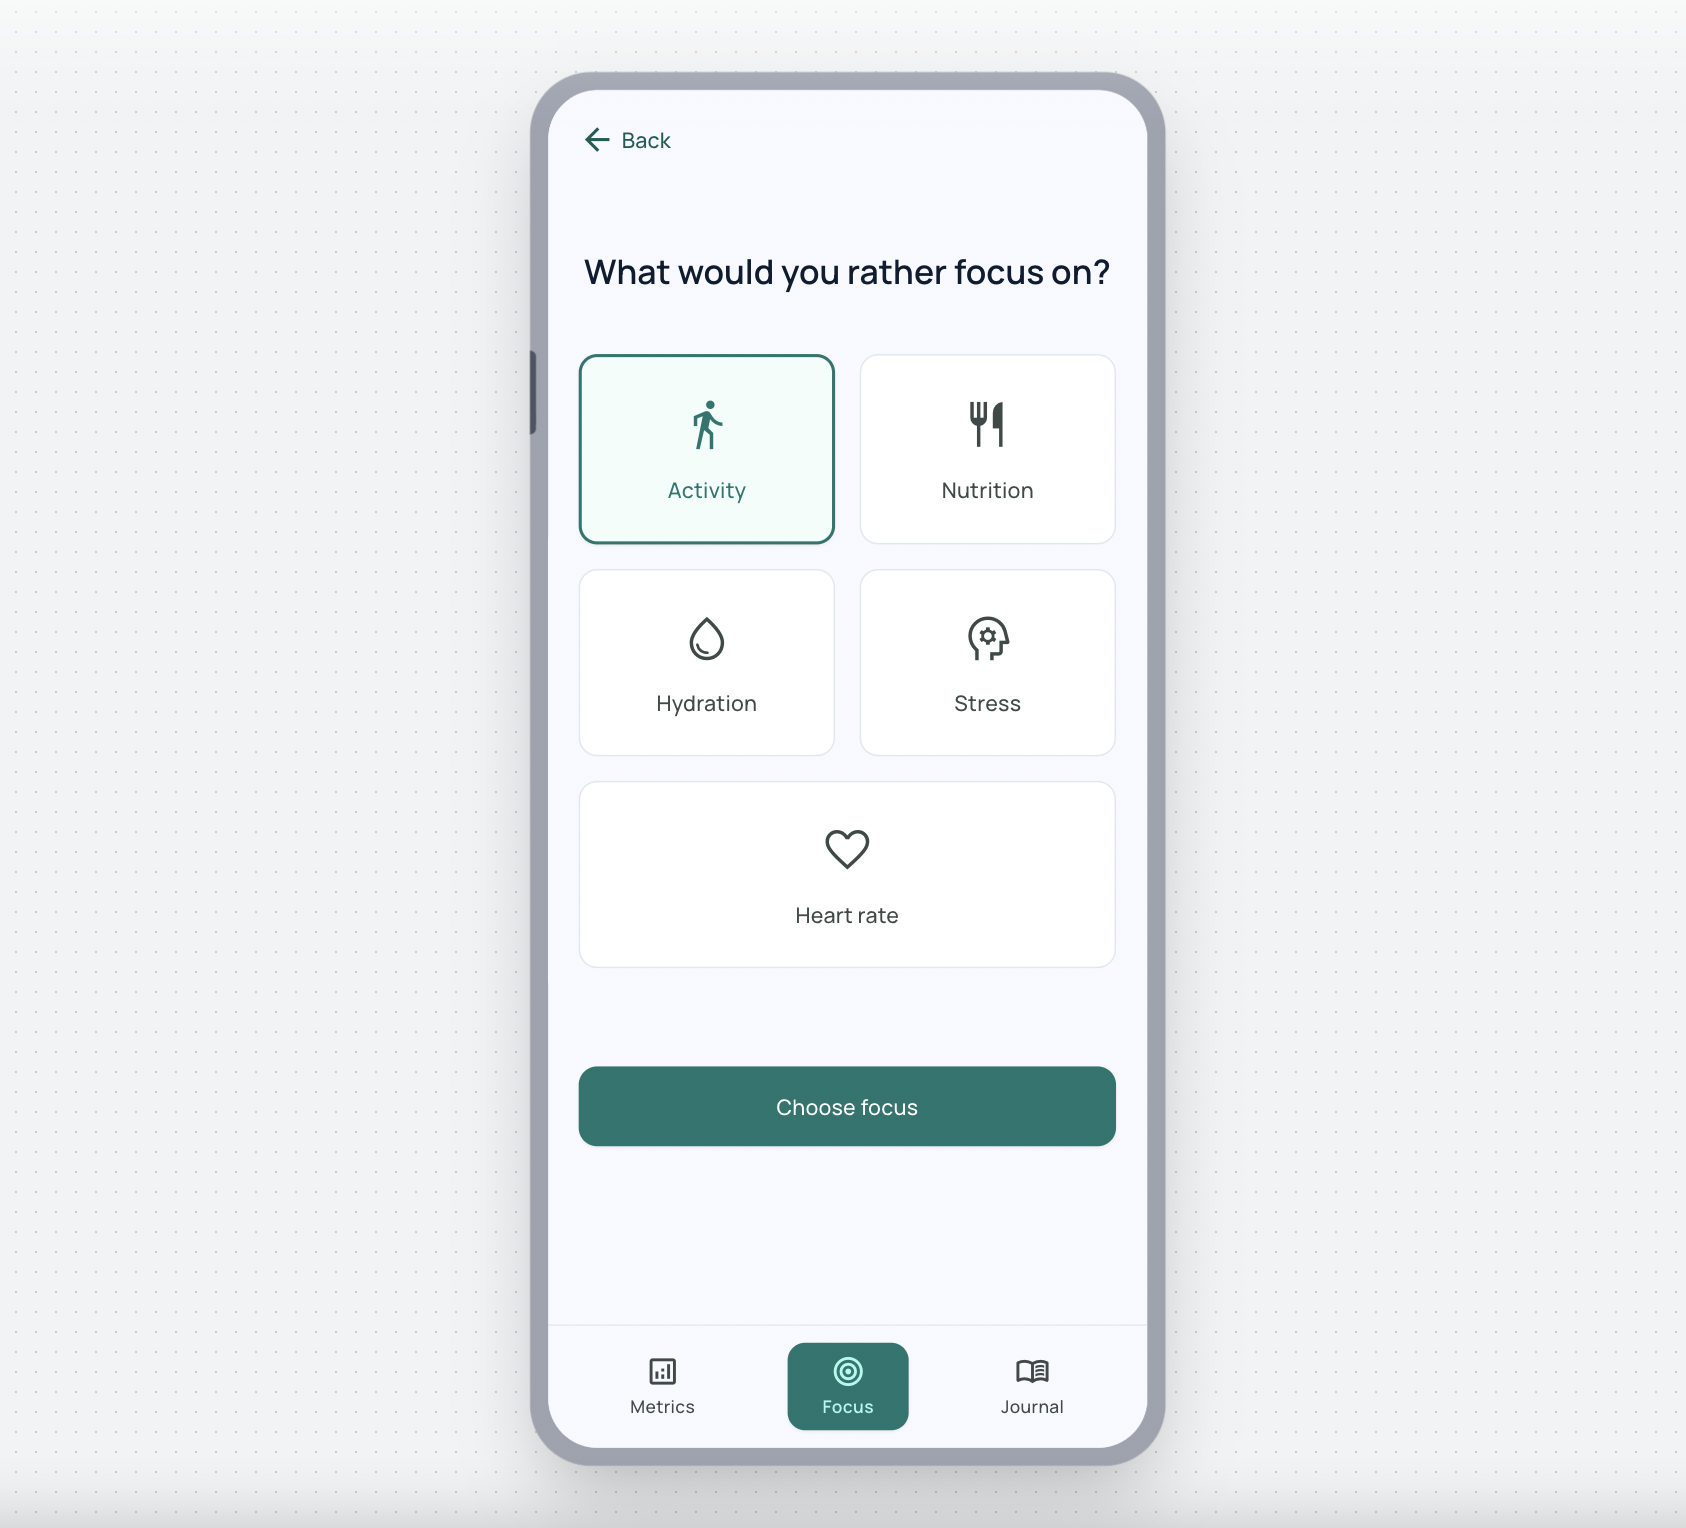
Allowing user to choose a different focus than what the AI recommended
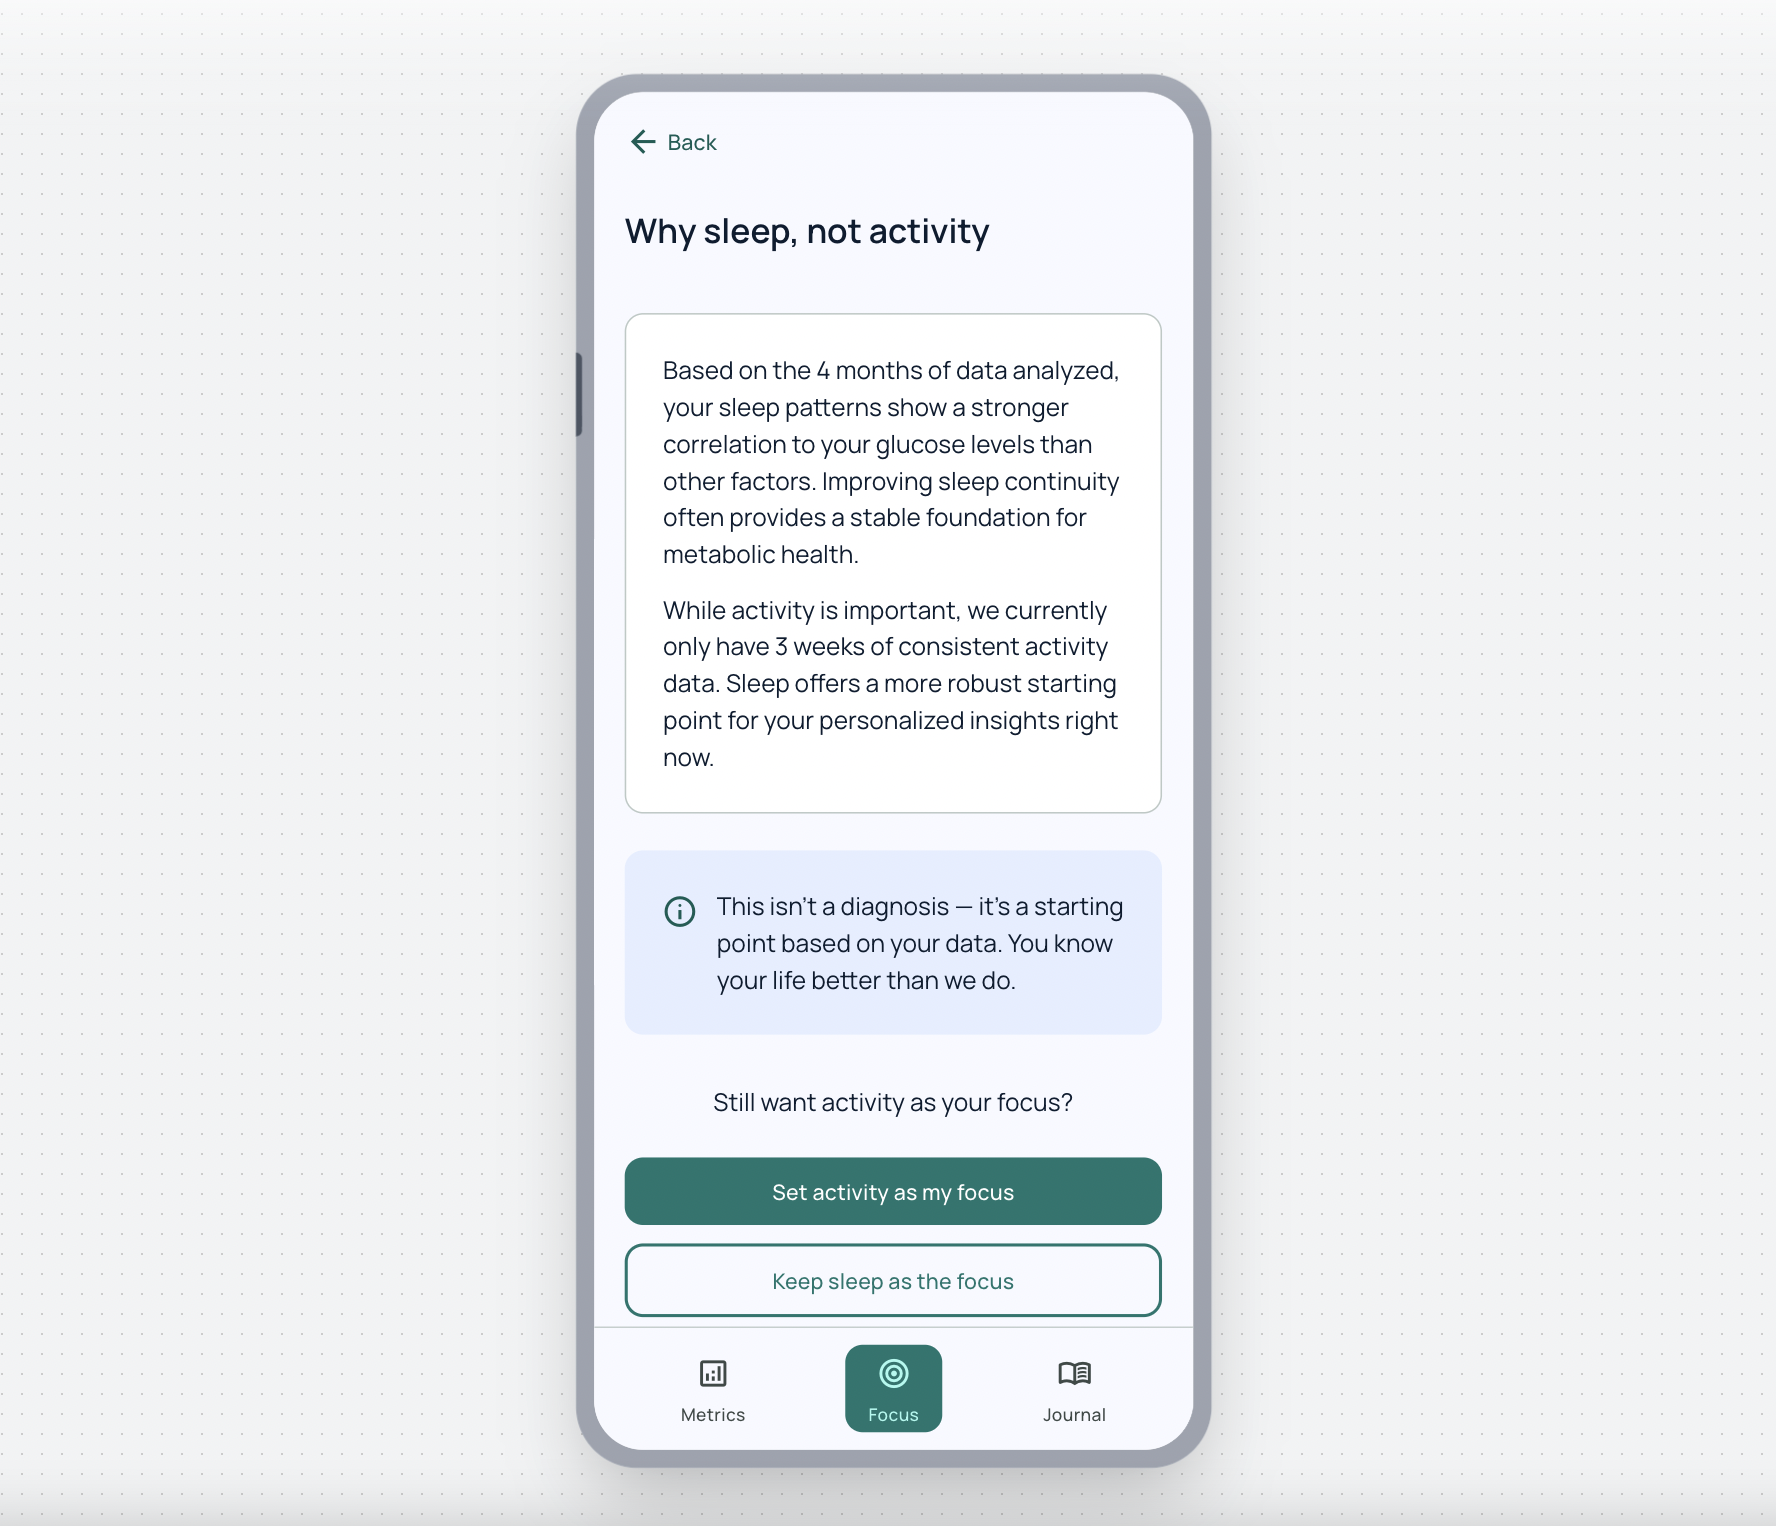
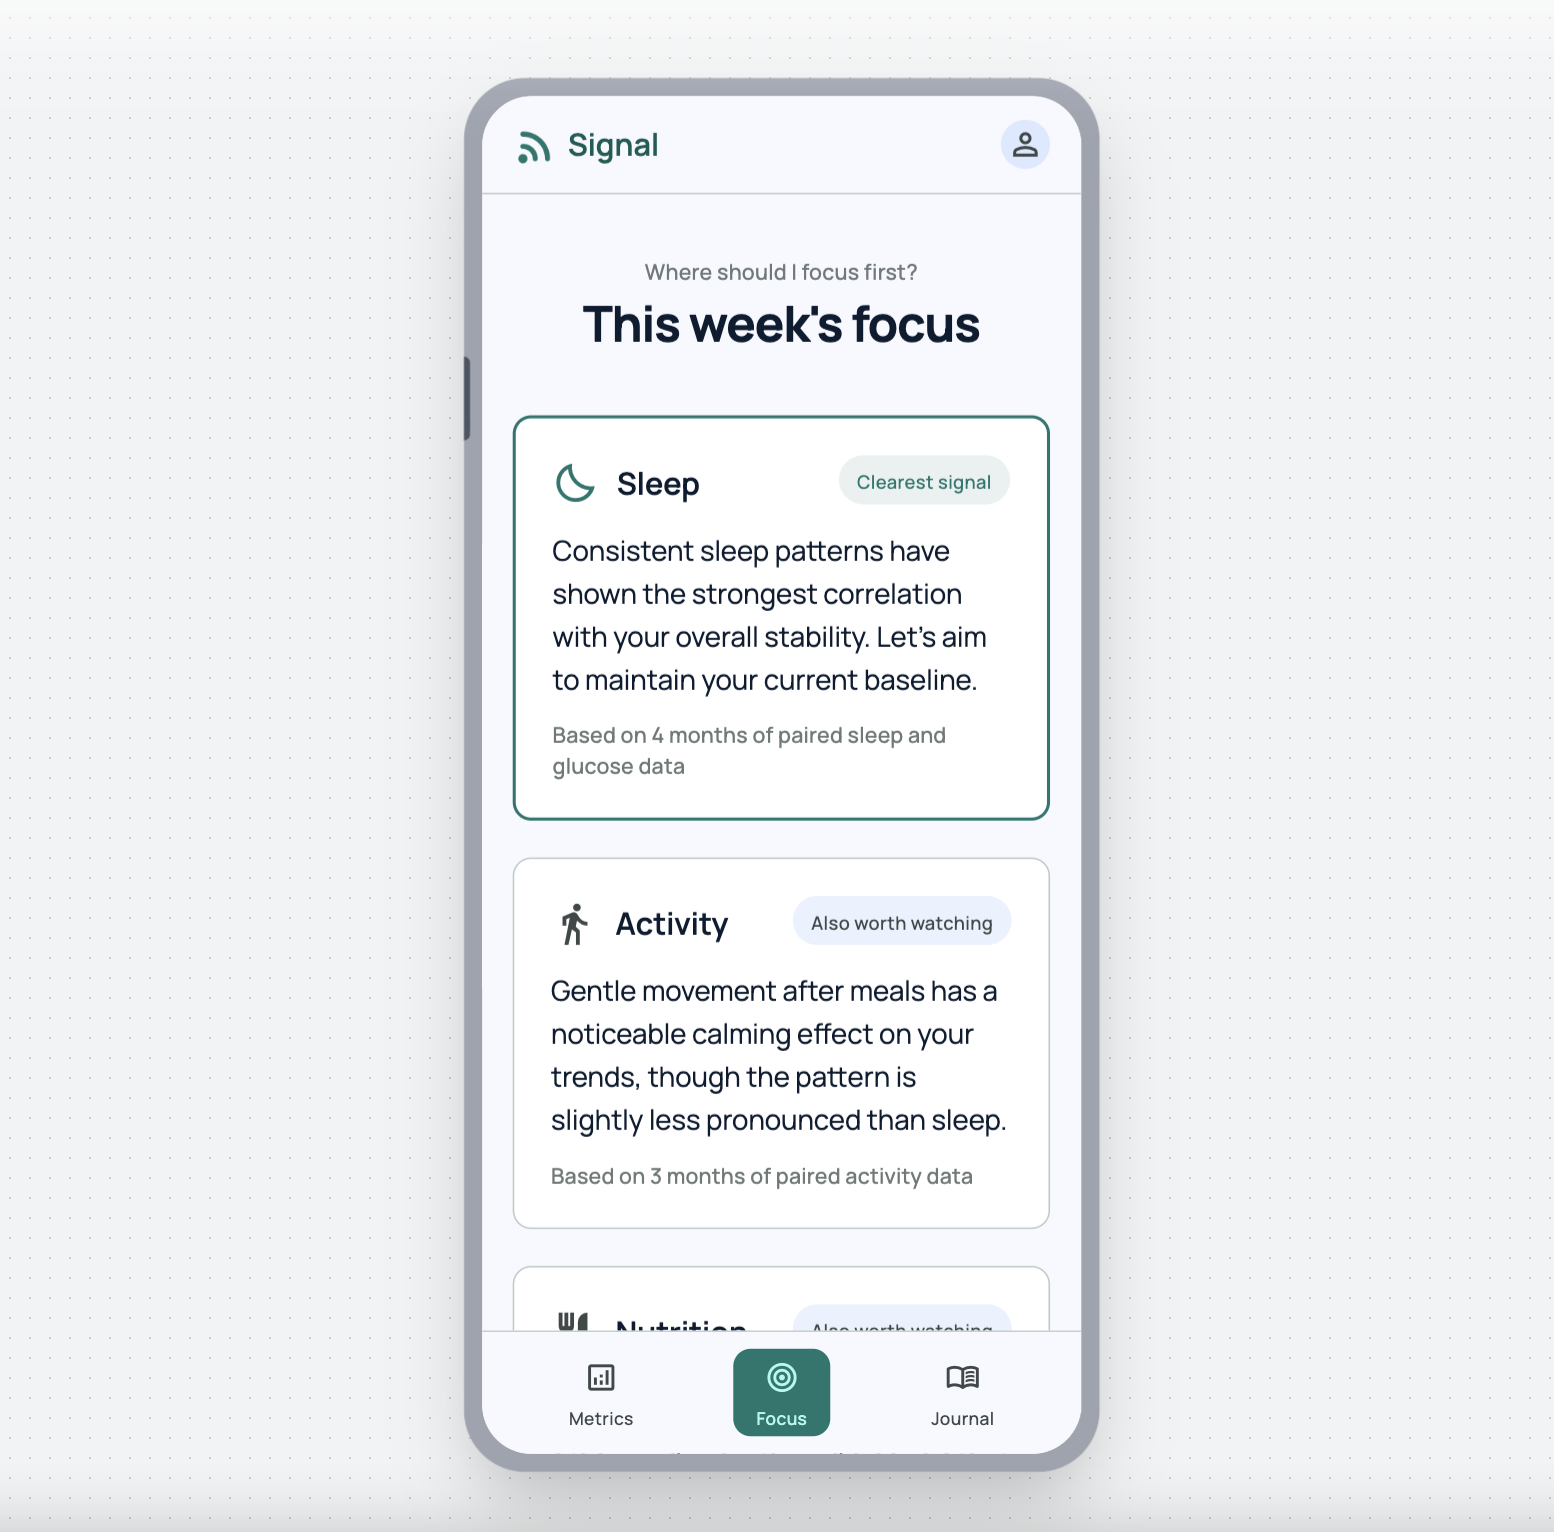
Giving user transparency telling it why the AI made the decisions it did
AI Preventative Health Tracking

Context:

This is a concept project. The app uses AI to help health users decide which lifestyle factor they should focus on for the week to improve their health, which uses data from their wearable devices and lab results.

Problem to be solved:

Help users prevent diabetes and heart disease by allowing AI to help them understand how to make lifestyle decisions.

My role:

I first started with Claude by using it to help refine the app idea and generate multiple visual ideations. From there, I went into an AI prototyping tool (v0 then Google Stitch), giving it prompts that I had asked Claude to generate for me.

Key decisions & trade-offs:

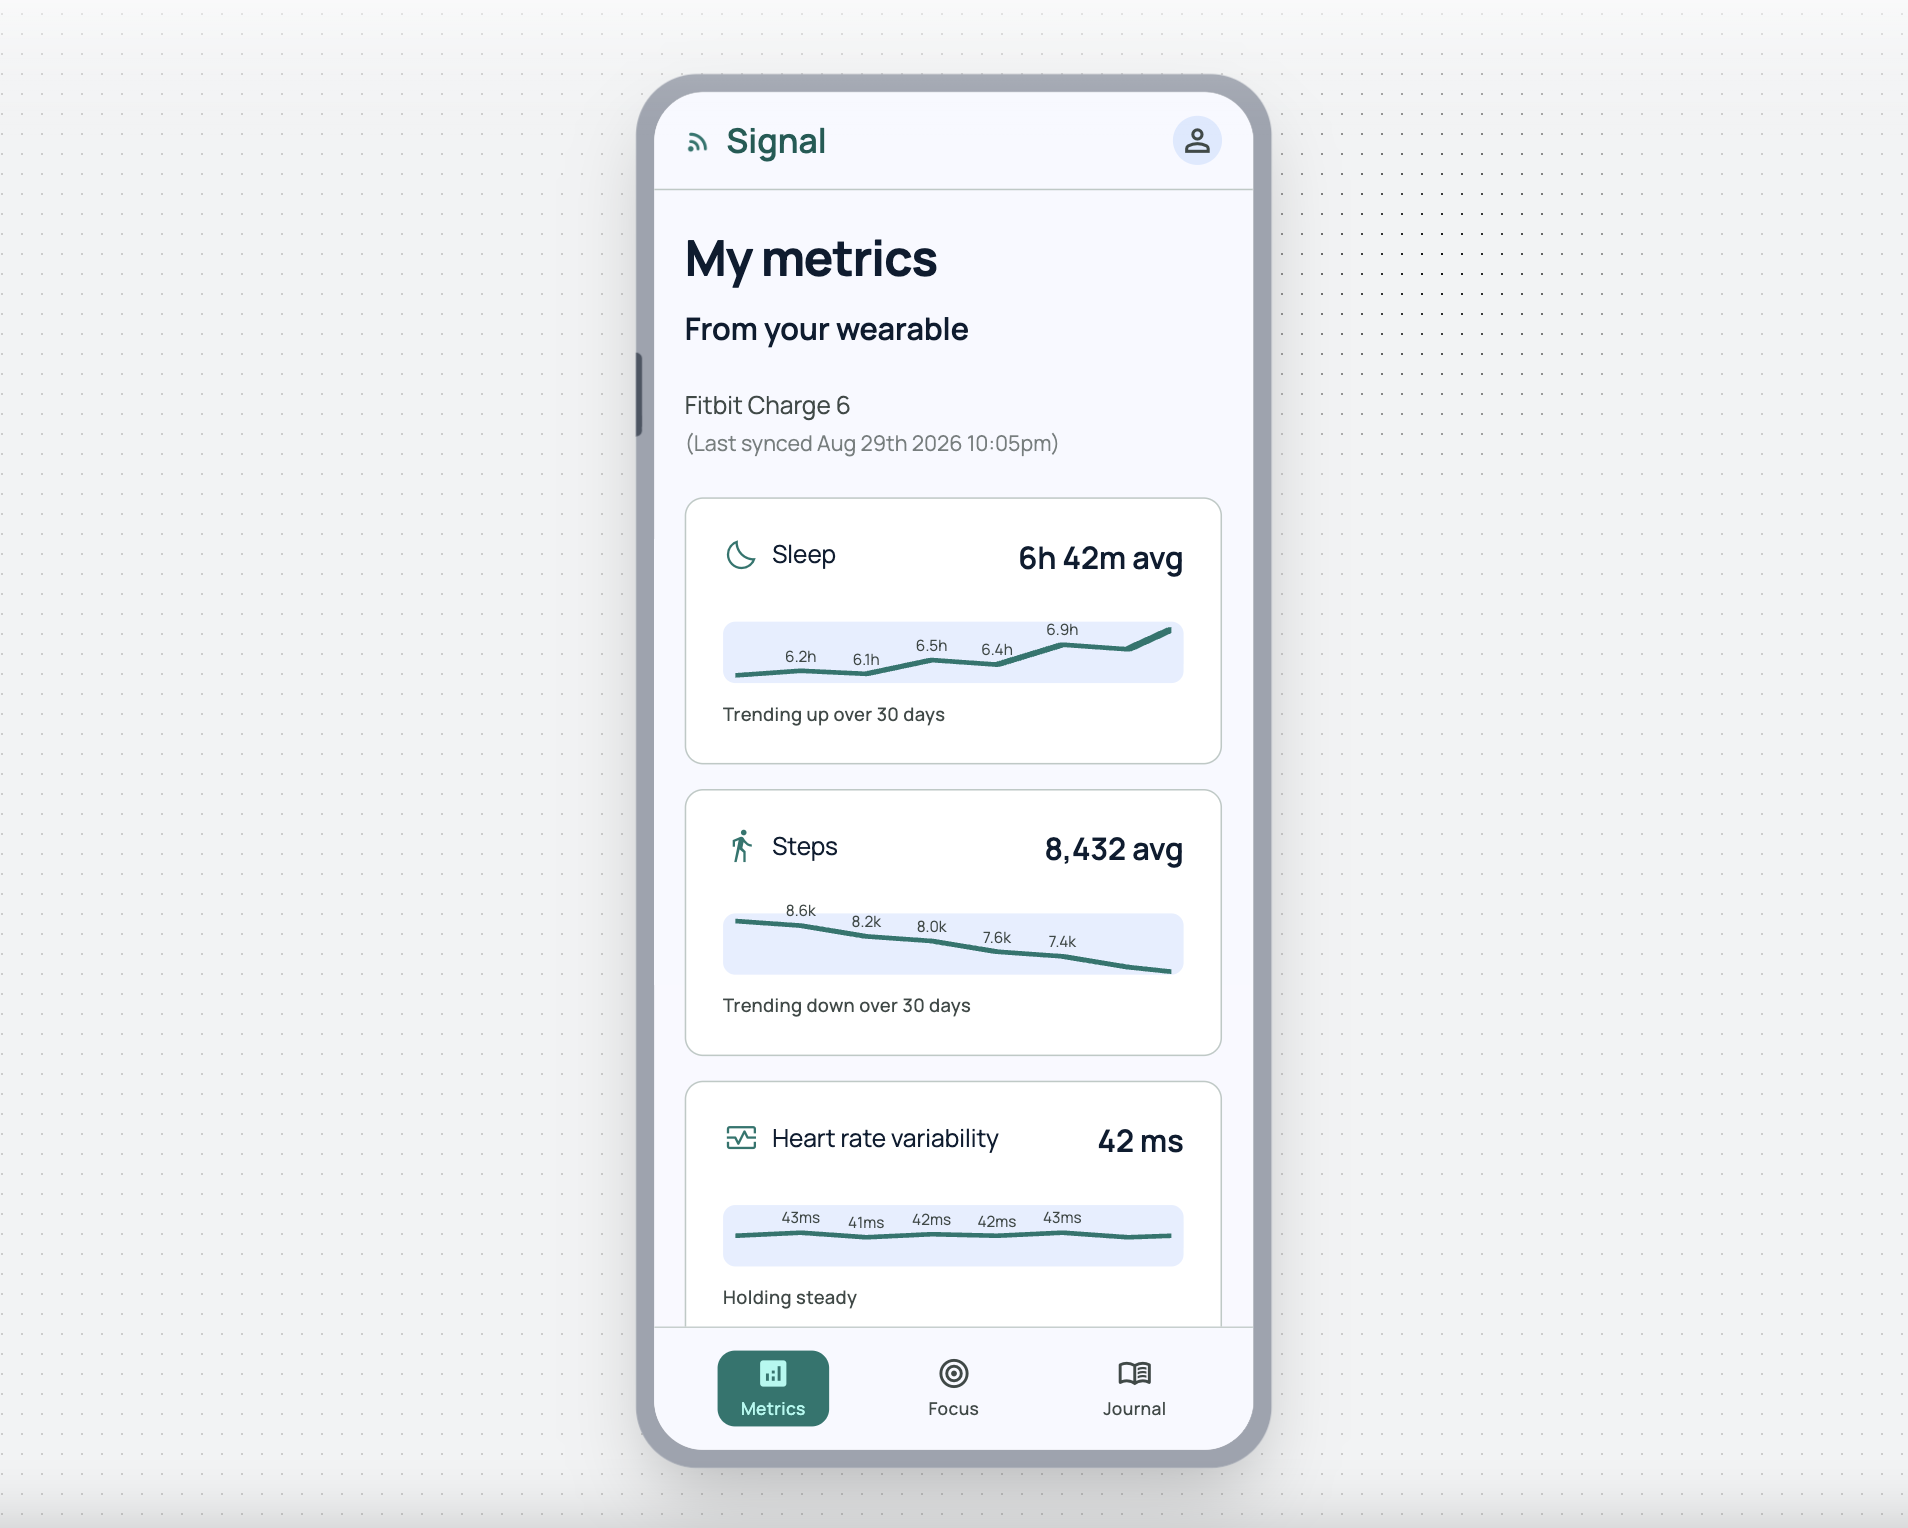
There were multiple points of judgement I had to make to decide what to use from the AI and what not to use. For example, the most important part of the app was having users understand the reasoning behind the recommendations. Of the multiple ideations Claude gave me for the signal concepts, I chose to use the variation that used text to explicitly tell the users what the signal meant and also stated which metrics it was using. I chose this rather than confidence numbers or progress bars because it gave the most transparency and handled uncertainty well by telling users what it was basing the signal on and in some instances letting them know it didn't have enough data. Another important part of the flow was having the users be able to override the AI recommendation, keeping the human-in-the-loop flow. I allow the users to choose a different focus but when doing so, I have the app tell them why the AI chose that specific recommendation which is based on their health data. Also, I decided to change the visual of the metrics from a bar graph to a line graph, as well as changing titles of sections and screens and spacing. Parts of the app that the AI did not create which I added in were: the inclusion of which wearable device the user has as well as the date and time it was last synced. I also had it order the recommendation cards by strongest signals, rather than randomly. Also, added numbers to the points on the metric graphs.

Challenges:

The AI tools themselves were the biggest challenge. I started first with v0 for prototyping, but shortly after making the first screens, my credits ran out due to v0 fixing its own errors. v0 also doesn't have a good way to show you all the screens in your app. I then switched to Google Stitch which I really like, although because it is a prompt-only edit tool, there were various issues when it didn't actually change the screen with the prompts. I also realized with all the AI tools right now there is a hard limitation with the "start in AI tool > fine-tune in Figma > back to AI tool" process, where the AI tool undoes some of what's been done in the Figma polish. I read that the Figma MCP for the design system can help this, although it doesn't get it right 100% of the time.

Outcome:

This is a concept project so there's no production data to report, though here's what I'd measure if it shipped:

  • Override rate on AI recommendations (how often users pick "something else" instead of the top suggestion). High override rate might mean the confidence signals aren't trustworthy, or the data model is wrong.

  • Time-to-decision on the "This week's focus" screen. Does showing reasoning/confidence actually help people decide faster, or does it add friction?

  • Return rate to the explanation screen. Are people re-reading "why" repeatedly, which might signal the first explanation isn't landing.

  • Whether users who override toward a lower-confidence factor eventually come back to the higher-confidence one. Does the system's judgment hold up over time?

  • Whether users interpret 'not enough data yet' as reassuring or as a flaw in the product.

Date:

2026
AI Preventative Health Tracking

AI Preventative Health Tracking

Skill IQ

Skill IQ

Unified Shopping Cart

Unified Shopping Cart

SmartTravel

SmartTravel

MCP - Model Context Protocol POC

MCP - Model Context Protocol POC

My Analytics

My Analytics

© 2026